NCERT CBSE for Class 10 Maths Chapter 14 Statistics Important Questions
Statistics Class 10 Important Questions Very Short Answer (1 Mark)
Question 1.
In a continuous frequency distribution, the median of the data is 21. If each observation is increased by 5, then find the new median.
Year of Question: (2015)
Solution:
New median = 21 + 5 = 26
Question 2.
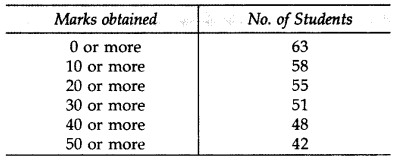
From the following frequency distribution, find the median class:
Year of Question: (2015)
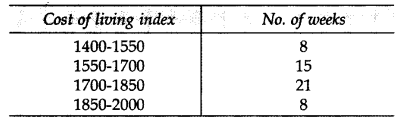
Solution:
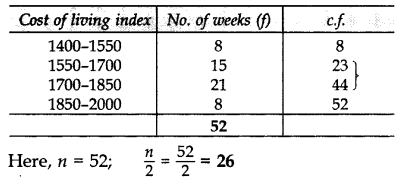 ∴ Median class 1700 - 1850.
Question 3.
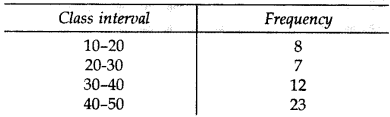
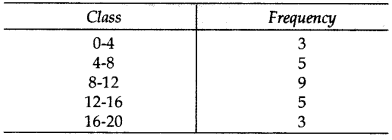
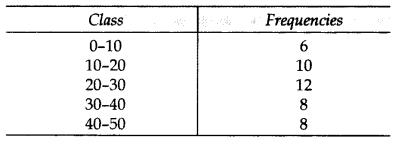
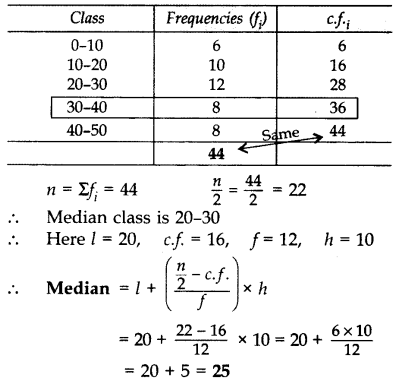
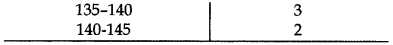
Consider the following distribution, find the frequency of class 30-40.
Year of Question: (2013)
Solution:
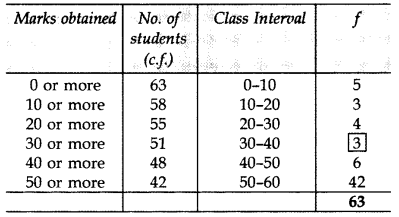 ∴ Frequency of class 30 - 40 = 3
Question 4.
Following table shows sale of shoes in a store during one month:
Year of Question: (2014)
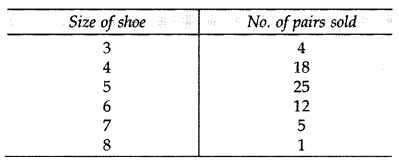
Find the model size of the shoes sold.
Solution:
Maximum no. of pairs sold = 25 (size 5)
∴ Modal size of shoes = 5
Question 5.
Weekly household expenditure of families living in a housing society are shown below:
Year of Question: (2014)
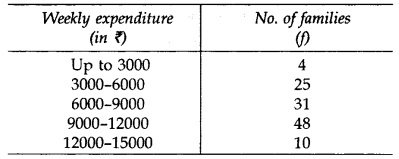
Find the upper limit of the modal class.
Solution:
Maximum frequency = 48
∴ Modal class = 9,000 - 12,000
Upper limit of the modal class = 12,000
Statistics Class 10 Important Questions Short Answer-I (2 Marks)
Question 6.
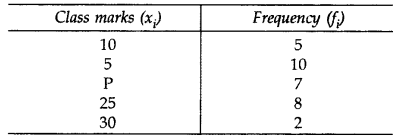
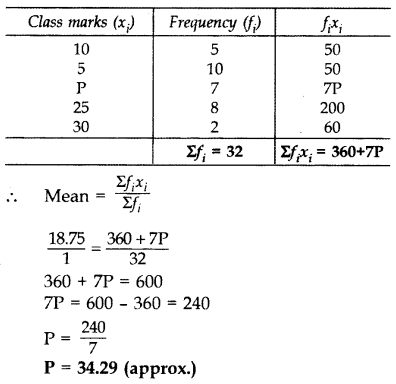
The mean of the following data is 18.75. Find the value of P:
Year of Question:(2012, 2017D)
Solution:
Question 7.
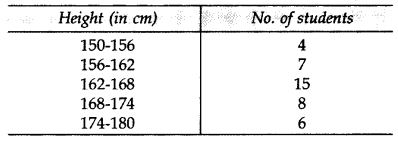
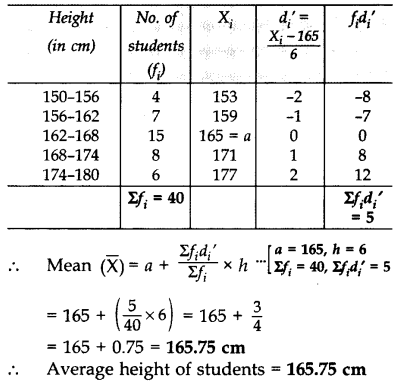
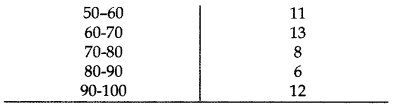
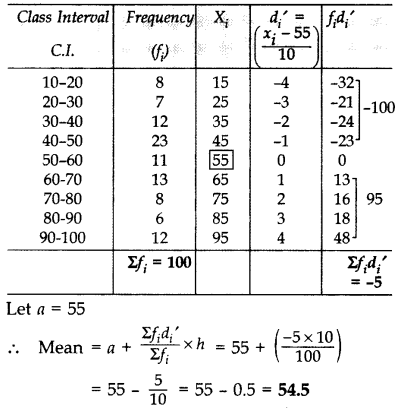
Data regarding heights of students of Class X of Model School, Dehradun is given below. Calculate the average height of students of the class.
Year of Question: (2015)
Solution:
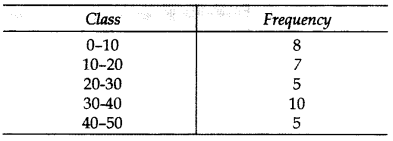
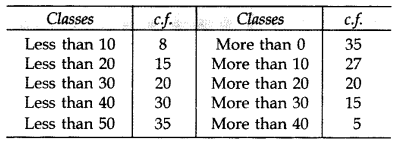
Question 8.
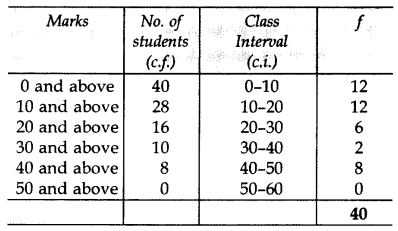
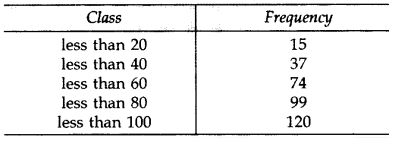
From the following cumulative frequency table, construct a frequency distribution table:
Year of Question:(2013)
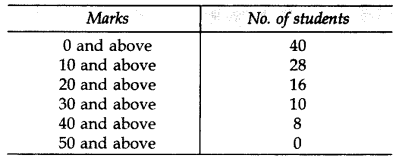
Solution:
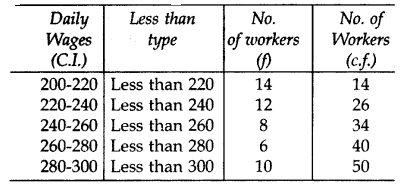
Question 9.
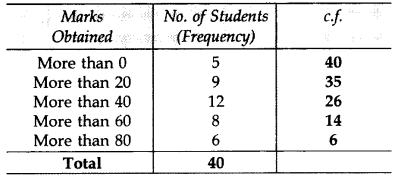
Convert the following frequency distribution to a ‘more than’ type cumulative frequency distribution.
Year of Question:(2012)
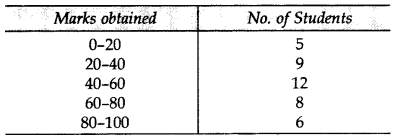
Solution:
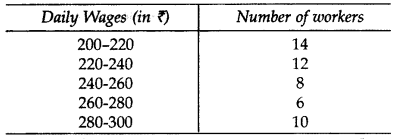
Question 10.
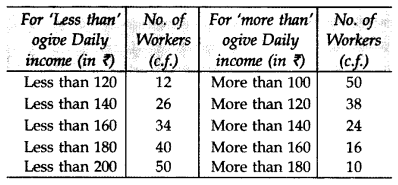
The distribution given below gives the daily income of 50 workers in a factory:
Year of Question:(2017D)
Solution:
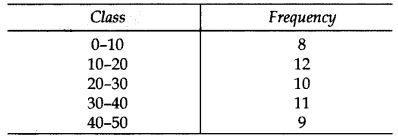
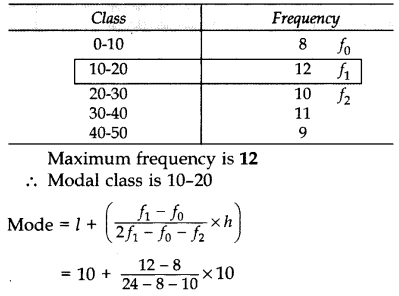
Question 11.
Find the mode of the following frequency distribution:
Year of Question:(2013)
Solution:
Question 12.
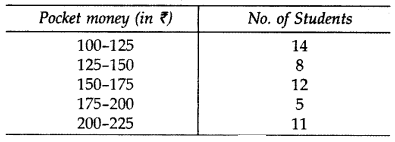
Given below is the distribution of weekly pocket money received by students of a class. Calculate the pocket money that is received by most of the students.
Year of Question:(2014)
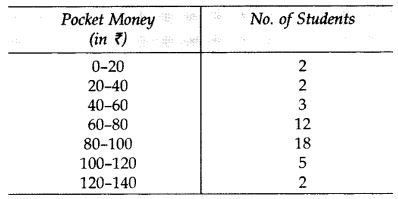
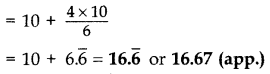
Solution:
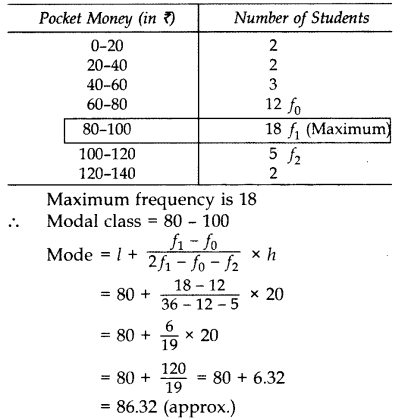 ∴ Required pocket money = ₹86.32 (approx.)
Question 13.
Find the median of the data using an empirical formula, when it is given that mode = 35.3 and mean = 30.5.
Year of Question:(2014)
Solution:
Mode = 3(Median) - 2(Mean)
35.3 = 3(Median) - 2(30.5)
35.3 = 3(Median) - 61
96.3 = 3 Median
Median = 96.3/3 = 32.1
Question 14.
Show that the mode of the series obtained by combining the two series S1 and S2 given below is different from that of S1 and S2 taken separately:
Year of Question:(2015)
S1 : 3, 5, 8, 8, 9, 12, 13, 9, 9
S2 : 7, 4, 7, 8, 7, 8, 13
Solution:
In S1 : Number 9 occurs 3 times (maximum)
∴ Mode of S1 Series = 9
In S2 : Number 7 occurs 3 times (maximum)
∴ Mode of S, Series = 7
After combination:
In S1 & S2 : No. 8 occurs 4 times (maximum)
∴ Mode of S1 & S2 taken combined = 8
So, mode of S1 & S2 combined is different from that of S1 & S2 taken separately.
Statistics Class 10 Important Questions Short Answer-II (3 Marks)
Question 15.
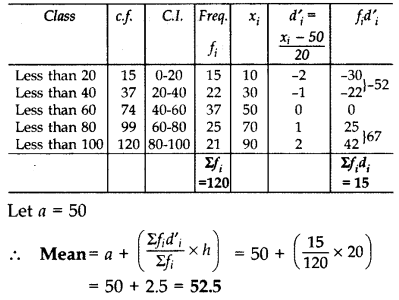
Find the mean of the following data.
Year of Question:(2012)
Solution:
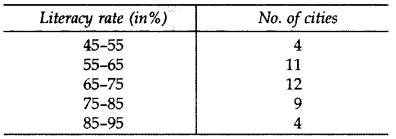
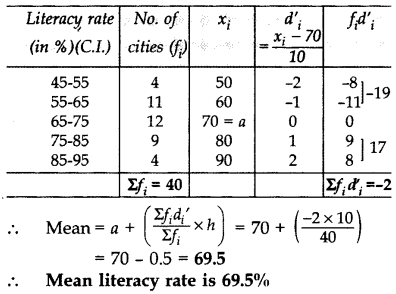
Question 16.
The following table gives the literacy rate (in %) in 40 cities. Find the mean literacy rate:
Year of Question:(2012)
Solution:
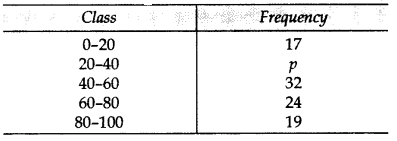
Question 17.
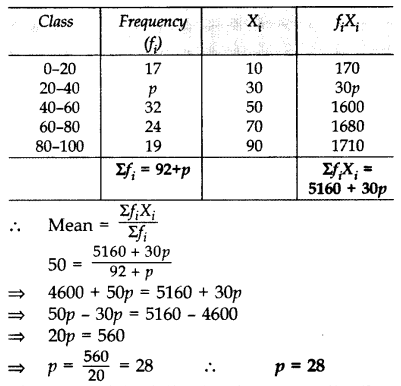
If the mean of the following distribution is 50, find the value of p:
Year of Question:(2013)
Solution:
Question 18.
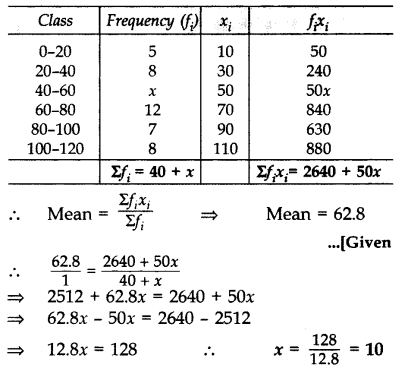
The mean of the following frequency distribution is 62.8. Find the missing frequency x.
Year of Question:(2013)
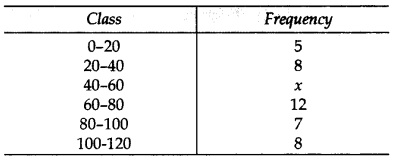
Solution:
Question 19.
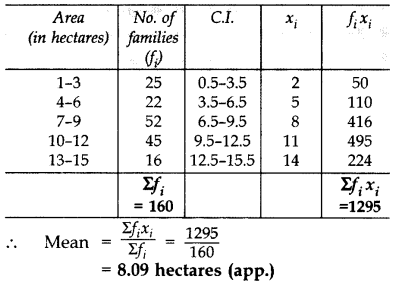
The frequency distribution table of agricultural holdings in a village is given below:
Year of Question:(2013)
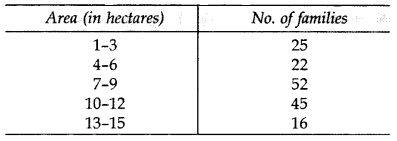
Find the Mean area held by a family.
Solution:
Question 20.
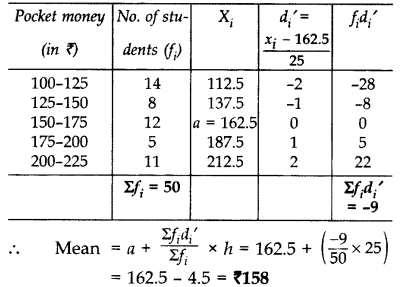
Monthly pocket money of students of a class is given in the following frequency distribution:
Find mean pocket money using step deviation method.
Year of Question:(2014)
Solution:
Question 21.
Find the mean of the following distribution by Assumed Mean Method:
Year of Question:(2015)
Solution:
Question 22.
Find the mean and median for the following data:
Year of Question:(2015)
Solution:

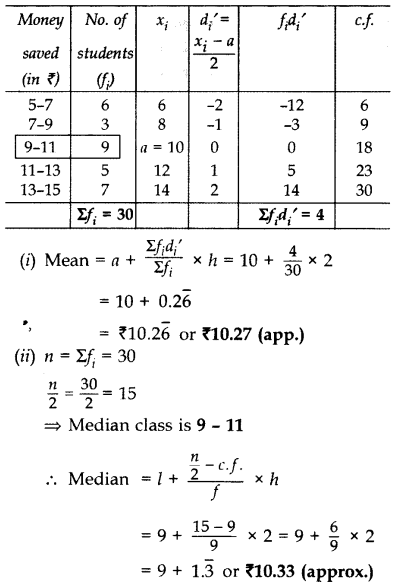
Question 23.
For helping poor girls of their class, students saved pocket money as shown in the following table:
Year of Question:(2014)
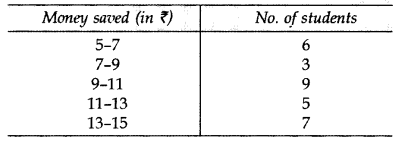
Find mean and median for this data.
Solution:
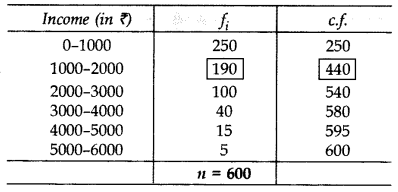
Question 24.
Weekly income of 600 families is given below:
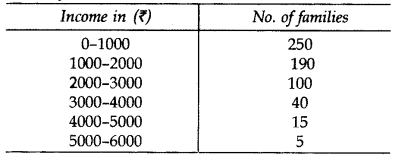
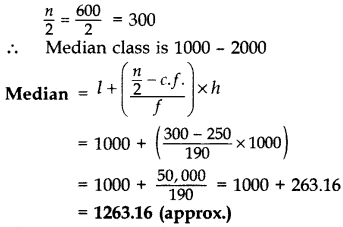
Find the median.
Year of Question:(2012)
Solution:
Question 25.
Find the median for the following distribution:
Year of Question:(2013)
Solution:
Question 26.
Heights of students of class X are given in the following frequency distribution:
Year of Question:(2014)
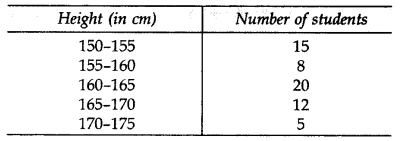
Find the modal height.
Solution:
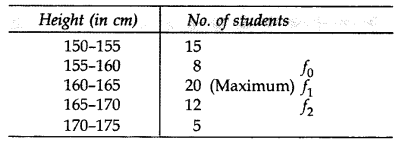
Maximum frequency is 20
∴ Modal class is 160 - 165
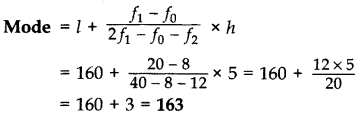 ∴ The modal height = 163 cm
Question 27.
A medical camp was held in a school to impart health education and the importance of excercise to children. During this camp, a medical check of 35 students was done and their weights were recorded as follows:
Year of Question:(2016)
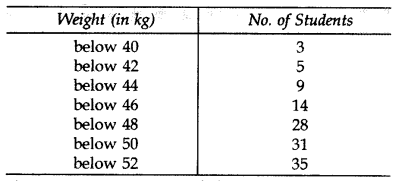
Compute the modal weight.
Solution:
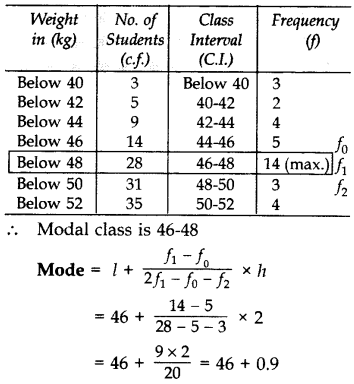
∴ Modal weight = 46.9 kg
Question 28.
The average score of boys in the examination of a school is 71 and that of the girls is 73. The average score of the school in the examination is 71.8. Find the ratio of number of boys to the number of girls who appeared in the examination.
Year of Question:(2015)
Solution:
Let the number of boys = n1
and number of girls = n2
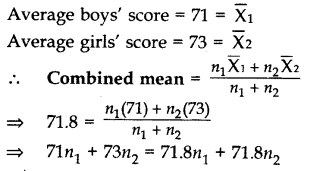
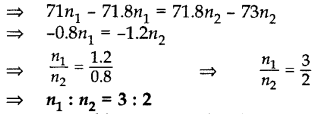 ∴ No. of boys : No. of girls = 3 : 2
Question 29.
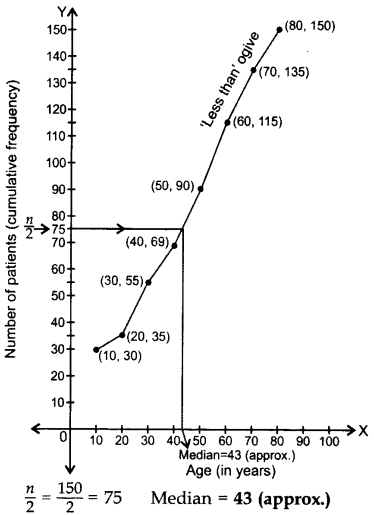
Following is the age distribution of dengue patients admitted in a hospital during a week of October, 2013:
Year of Question:(2014)
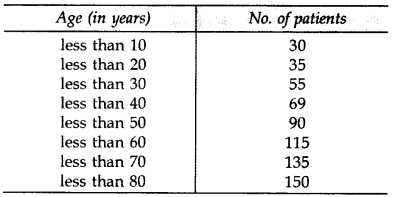
Draw a ‘less than type’ ogive for the above distribution. Also, obtain median from the curve.
Solution:
Question 30.
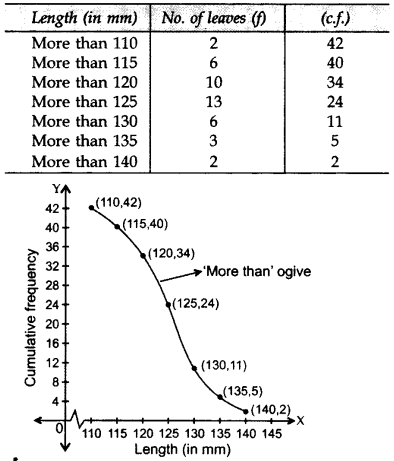
The lengths of leaves of a plant are measured correct to the nearest mm and the data obtained is represented as the following frequency distribution:
Year of Question:(2015)
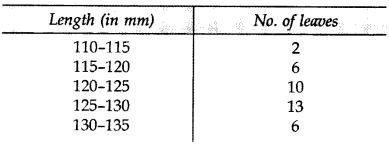
Draw a‘more than type’ ogive for the above data.
Solution:
Statistics Class 10 Important Questions Long Answer (4 Marks)
Question 31.
The mean of the following frequency distribu tion is 53. But the frequencies f1 and f2 in the classes 20-40 and 60-80 are missing. Find the missing frequencies:
Year of Question:(2013)
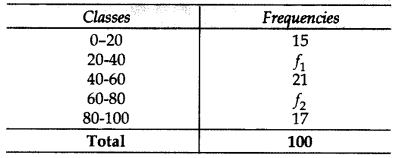
Solution:
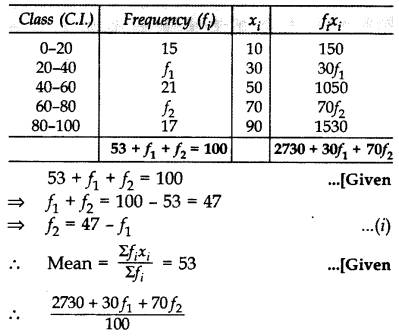
⇒ 2730 + 30f1 + 70f2 = 5300
⇒ 30f1 + 70f2 = 5300 - 2730 = 2570
⇒ 3f1 + 7f2 = 257 .[Dividing by 10
⇒ 3f1 +7(47 - f1) = 257 . [From (i)
⇒ 3f1 + 329 - 7f1 = 257
⇒ -4f1 = 257 - 329 = -72
⇒ f1 = -72/-4 = 18
Putting the value of f1 in (i), we get
f2 = 47 - f1
⇒ f2 = 47 - 18 = 29
∴f1 = 18, f2 = 29
Question 32.
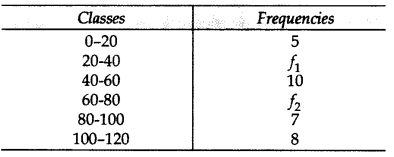
The mean of the following frequency distribution is 62.8 and the sum of frequencies is 50. Find the missing frequencies f1 and f2:
Year of Question:(2013)
Solution:
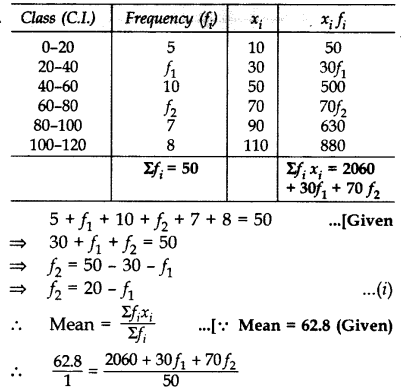
⇒ 2060 + 30f1 + 70f2 = 3140
⇒ 30f1 + 70f2 = 3140 - 2060 = 1080
⇒ 3f1 + 7f2 = 108 .[Dividing by 10
⇒ 3f1 + 7(20 - f1) = 108 . [From (i)
⇒ 3f1 + 140 - 7f1 = 108
⇒ -4f1 = 108 - 140 = -32 .
∴ f1 = 8
Putting the value of f1 into (i), we get
f2 = 20 - 8 = 12
∴ f2 = 12
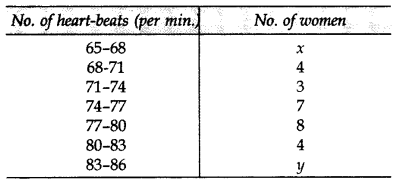
Question 33.
In the table below, heart-beats of 30 women are recorded. If mean of the data is 76, find the missing frequencies x and y.
Year of Question:(2014)
Solution:
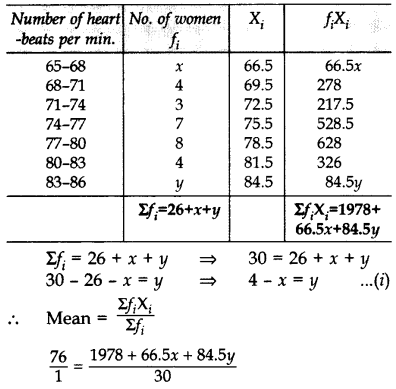
⇒ 1978 + 66.5x + 84.5y = 2280
⇒ 1978 + 66.5x + 84.5(4 - x) = 2280 . [From (i)
⇒ 1978 + 66.5x + 338 - 84.5x = 2280
⇒ 1978 + 338 - 2280 = 84.5x - 66.5x
⇒ 36 = 18x ⇒ x = 2
From (i), y = 4 - x = 4 - 2 = 2 ? x = 2, y = 2
Question 34.
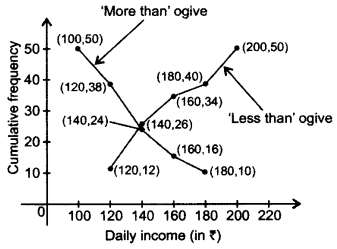
The following table gives the daily income of 50 workers of a factory. Draw both types ("less than type" and "greater than type") ogives.
Year of Question:(2015)

Solution:
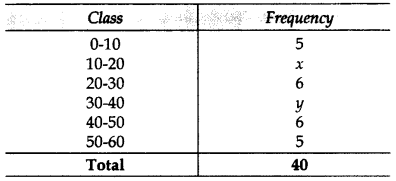
Question 35.
Find the values of x and y if the median for the following data is 31.
Year of Question:(2012)
Solution:
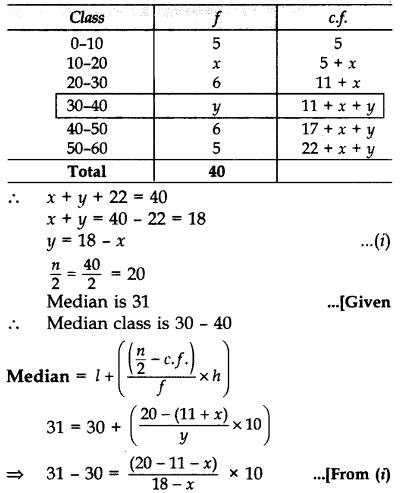
⇒ 18 - x = (9 - x)10
⇒ 18 - x = 90 - 10x
⇒ -x + 10x = 90 - 18
⇒ 9x = 72
⇒ x = 8
Putting the value of x in (i), we have
y = 18 - 8 = 10
∴ x = 8, y = 10
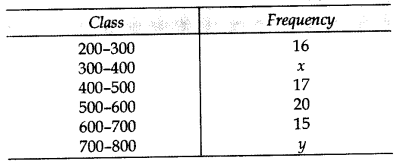
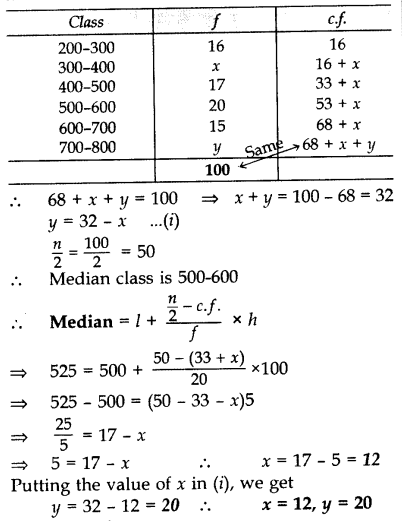
Question 36.
The median of the following data is 525. Find x and y if the sum of all frequencies is 100:
Year of Question:(2012, 2017 D)
Solution:
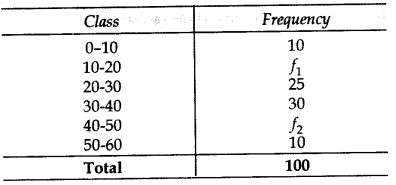
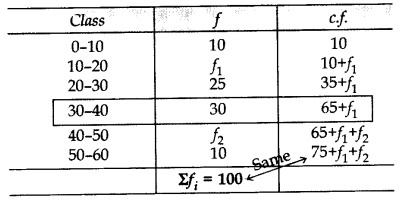
Question 37.
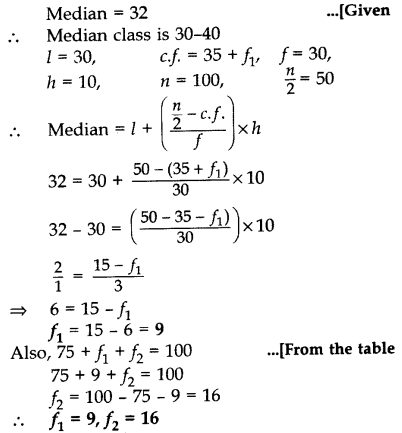
Find the missing frequencies f1 and f2 in the following frequency distribution table, if N = 100 and median is 32.
Year of Question:(2013)
Solution:
Question 38.
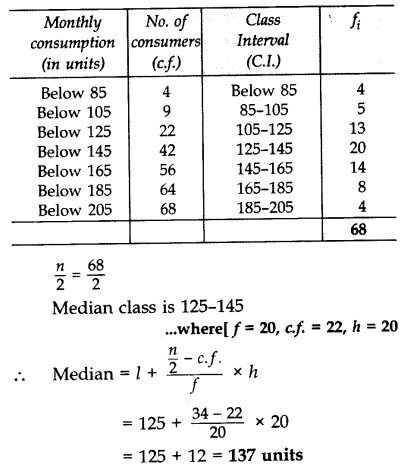
Find the median of the following data:
Year of Question:(2013)
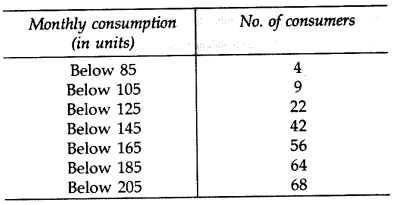
Solution:
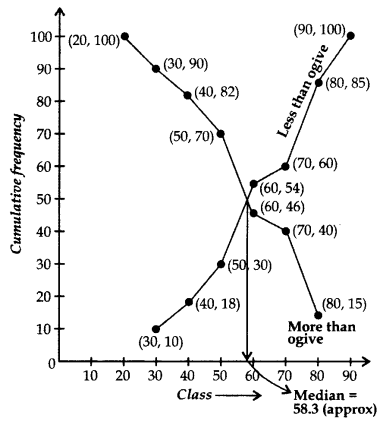
Question 39.
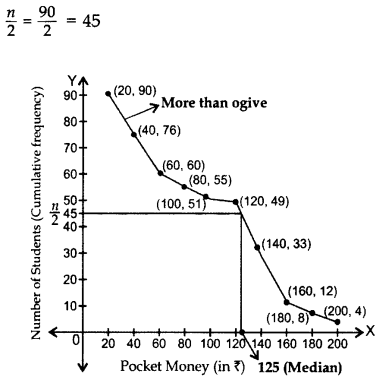
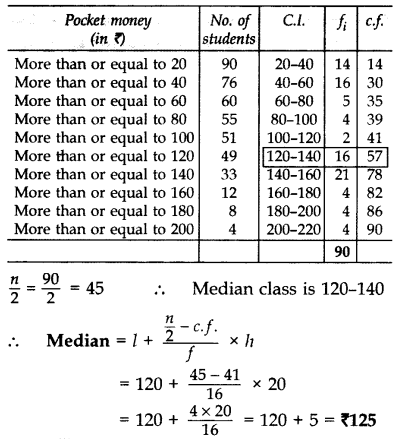
The frequency distribution of weekly pocket money received by a group of students is given below:
Year of Question:(2014)
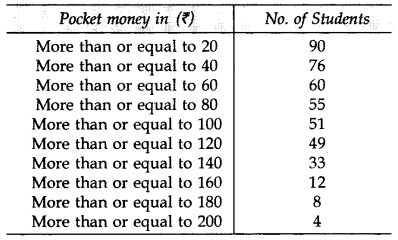
Draw a ‘more than type’ ogive and from it, find median. Verify median by actual calculations.
Solution:
n = 90 .[Given
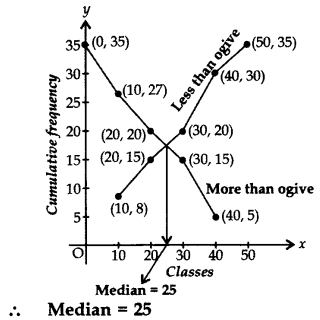
Question 40.
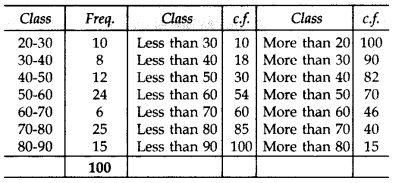
Draw "less than ogive" and "more than ogive" for the following distribution and hence find its median.
Year of Question:(2012)
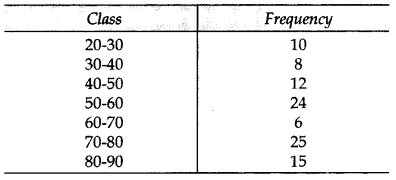
Solution:
Question 41.
Draw: (a) more than ogive and
Year of Question:(2017OD)
(b) less than ogive for the following data
Also find its median.
Solution:
Question 42.
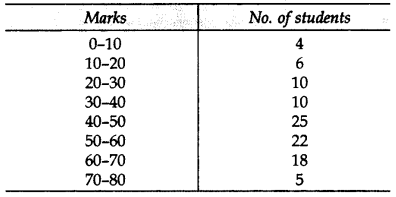
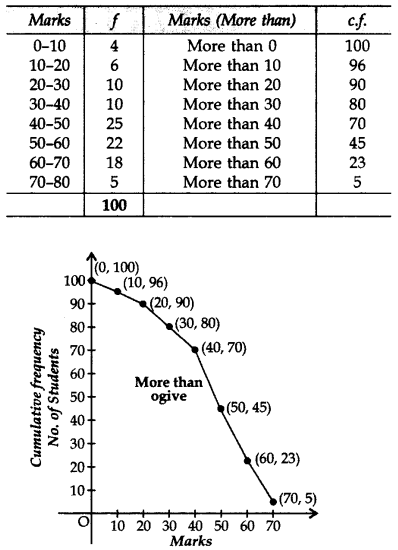
Draw a more than ogive for the data given below which gives the marks of 100 students:
Year of Question:(2012, 2017D)
Solution:
Question 43.
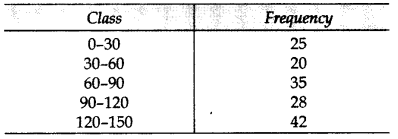
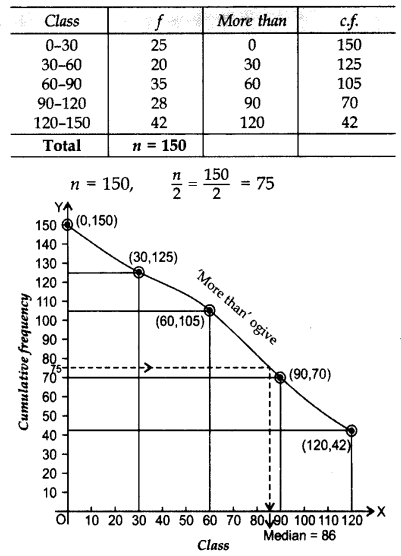
For the following distribution, draw a ‘more than Ogive’ and hence find the median:
Year of Question:(2013)
Solution:
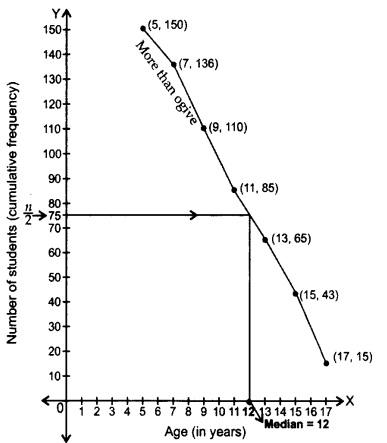
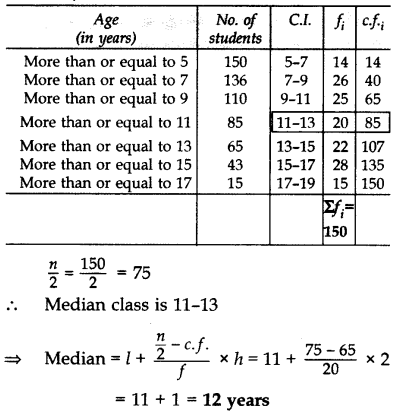
Question 44.
School held sports day in which 150 students participated. Ages of students are given in the following frequency distribution:
Year of Question:(2014)
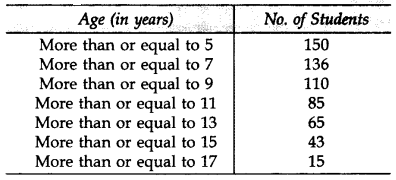
For the above data, draw a ‘more than type’ ogive and from the curve, find median. Verify it by actual calculations.
Solution:
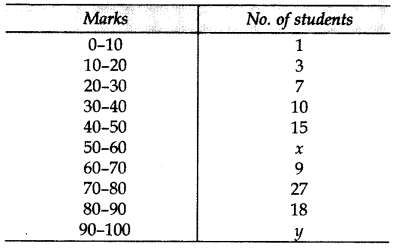
Question 45.
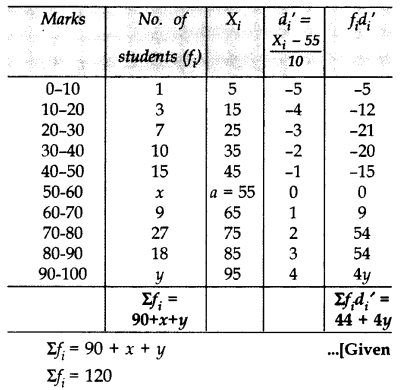
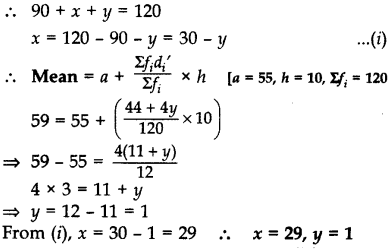
In a class test, marks obtained by 120 students are given in the following frequency distribution. If it is given that mean is 59, find the missing frequencies x and y.
Year of Question:(2015)
Solution:
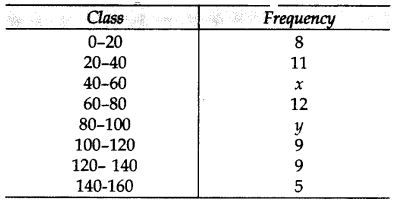
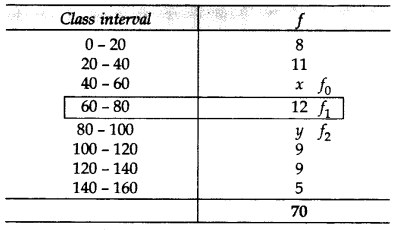
Question 46.
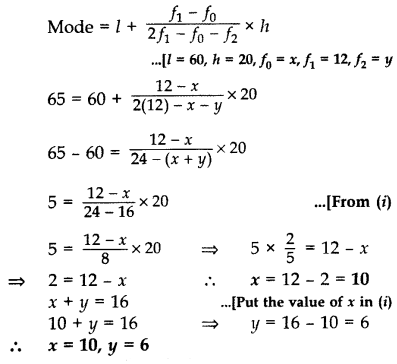
Mode of the following frequency distribution is 65 and sum of all the frequencies is 70. Find the missing frequencies x and y.
Year of Question:(2015)
Solution:
54 + x + y = 70 . [Given
x + y = 70 - 54 = 16 .(i)
∴ Mode = 65
Modal Class is 60 - 80
Question 47.
Find the mode of the following frequency distribution:
Year of Question:(2015)
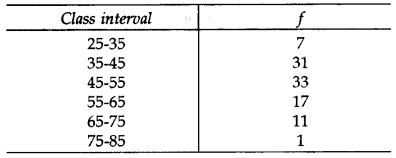
Solution:

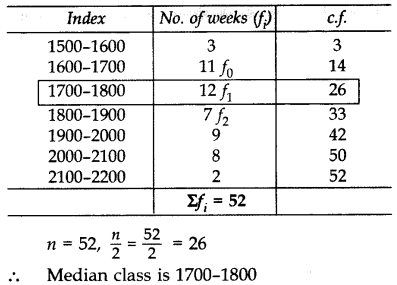
Question 48.
Cost of Living Index for some period is given in the following frequency distribution:
Year of Question:(2014)
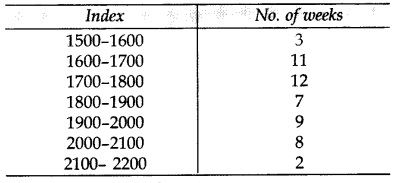
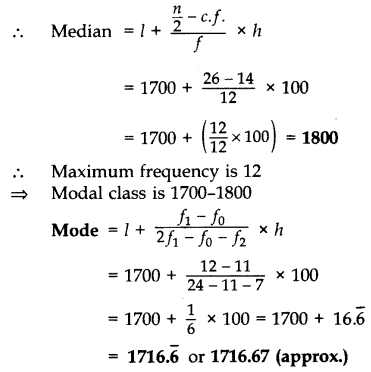
Find the mode and median for above data.
Solution: